The Move/VIX Ratio is now very fashionable
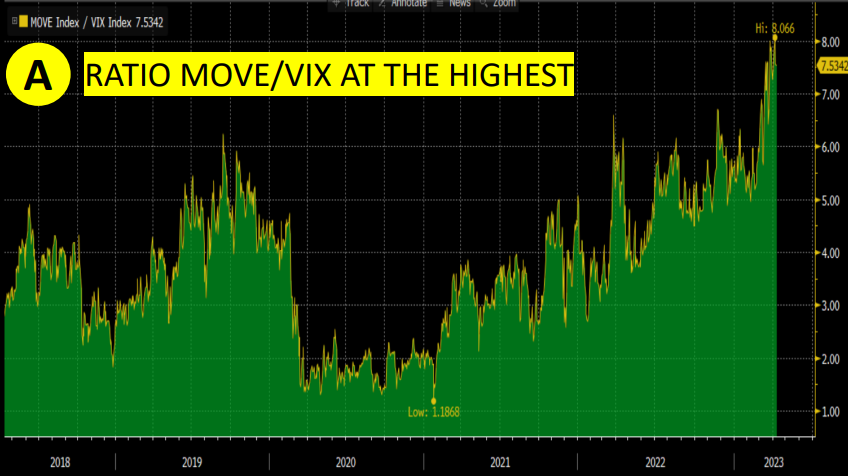
Recently, graphs comparing the MOVE Index to the VIX Index have flourished on our screens. Their authors look particularly smart as nobody was looking at MOVE before. Move is presented as the equivalent of VIX for fixed income and currently the ratio MOVE/VIX is around 8 (see graph A below), which corresponds to the recent highest.
Do not look further, this is the sign of an upcoming tsunami for stocks. The prophecy comes from analysts who can compute a ratio and who look at MOVE… that has to be true! Let’s consider ourselves lucky that the prophecy was communicated to us in plain English and not in some ancient language, it allows us to question it.
Looking at the definition, MOVE is a weighted average of the 1-month implied volatility of the 2y (20%), 5y (20%), 10y (40%) and 30y (20%) US treasuries. VIX is a strike-weighted average of the 1-month implied volatility of S&P500.
So why and how should MOVE and VIX be connected, and more generally how should rate vol and equity vol be connected?
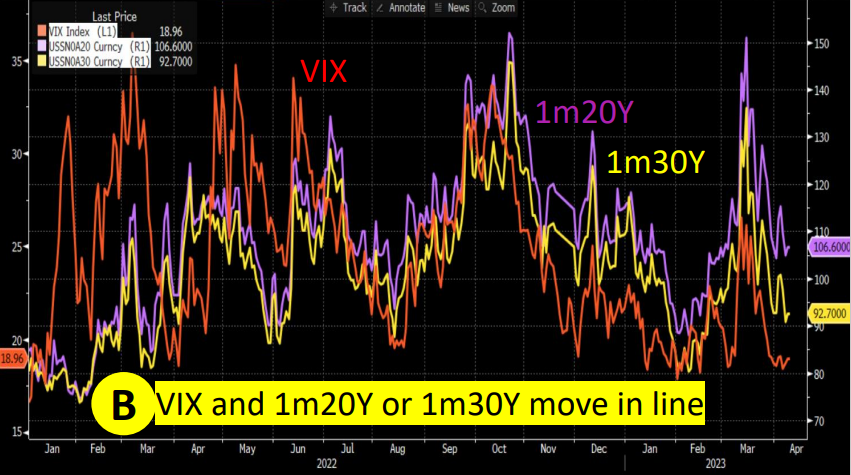
One way of looking at it is to consider the fundamental value of a stock as a strip of future discounted free cash flows. A stock price can then move if the expected future free cash flows are revised or when the discount factors are revised. The stock volatility is then the volatility of the free cash flows + the volatility of the discount factors + cross effects. To go further, one then needs to know the duration of US stocks. If I believe Franklin Templeton, it is 30 years for the FAANGM stocks and 20 years for the rest of the S&P (as of July 2022). In other words, as a good estimate, the volatility of a stock is a function of the volatility of the 20y or 30y treasury and the volatility of its expected profits (which translate into free cash flows). So if I want to relate the vol of stocks to the vol of treasuries I should look at 20 or 30y treasuries, certainly not at the 2y, 5y and 10y which make 80% of the MOVE. Looking at the correct maturities, indeed VIX and the vols of 1m20y and 1m30y seem very much related, as one can see on the graph B below, and the ratio fixed income vol / equity vol does not exhibit anything abnormal.
Tsunami gone.
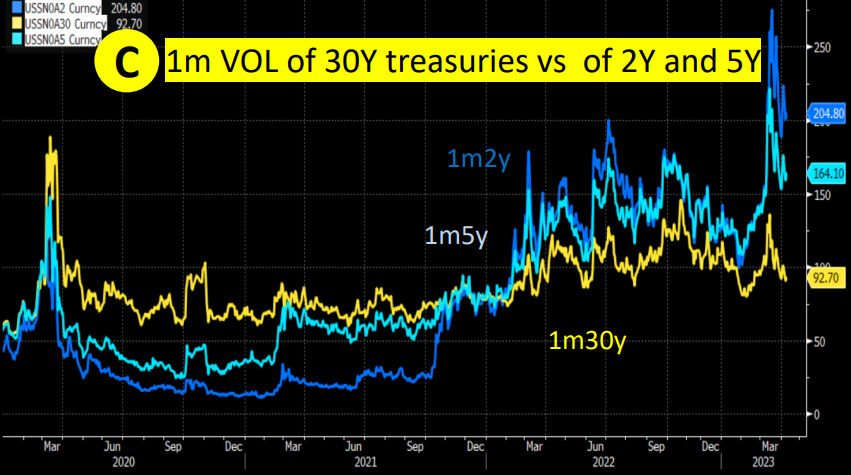
At the end of the day, comparing MOVE to VIX is equivalent to comparing the vol of short dated treasuries to the vol of long dated treasuries. And the high ratio MOVE/VIX is just saying that the implied vol of the short dated is high versus the implied vol of the long dated (𝗴𝗿𝗮𝗽𝗵 𝗖)…that should come as no surprise that the spread is particularly elevated in periods where monetary policy is volatile!