The HSCEI Index (Hang Seng China Enterprise Index) is having a horrible start of 2022. The combination of the early regulatory crackdown, new lockdowns in China due to a Covid resurgence and the risk that Russia-China ties may impact Chinese economy weighted heavily on the Chinese Equity Index.
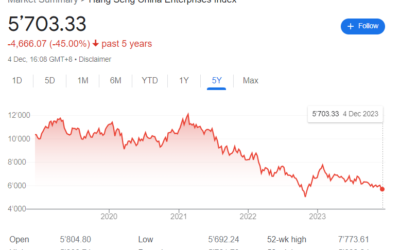
As of today ( March 15, 2022), the 2022 year-to-date performance of the Index is less than -25% and the HSCEI is down more than -45% since one year ago. (source bloomberg)
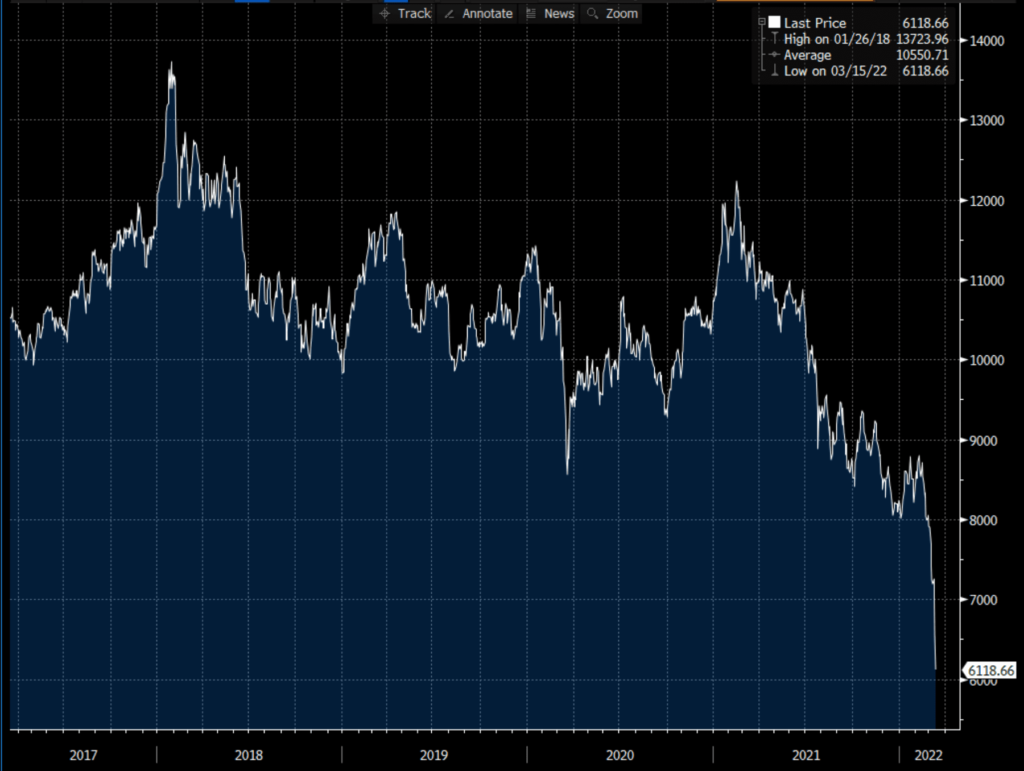
Performance of Hang Seng China Index (price return) over the last 5 years
That performance affects investors who are simply long equity but will affect structured product investors and dealers.
For the investors, unfortunately, the picture is clear : prior to its fall, the HSCEI was trading around the 10,000 mark. Now it is trading at 60% of that level. Obviously the mark-to-market of those products will be heavily impacted and one can expect them to trade around 60%. HSCEI has always been a very popular underlying for Asian investors so they will be impacted. But global investors will be affected also. Indeed we have behind us years of low interest rates and low implied volatilities that pushed structured products investors to go from worst of 3 indices (typically SX5E, SPX, NKY or SX5E, SPX, SMI) to worst of 4, 5, 6 indices….including HSCEI. We can expect HSCEI to drive the performance of all those autocalls now.
And for the dealers ?
The picture may not be much shinier. The risks of those autocalls are now concentrated on one single index. Dealers get long dividends and long repo on HSCEI. The effects are already observable as the HSCEI 2025 dividend future has dropped by 20% from 232 points on 18 february 2022 to 185 on 15 March 2022.
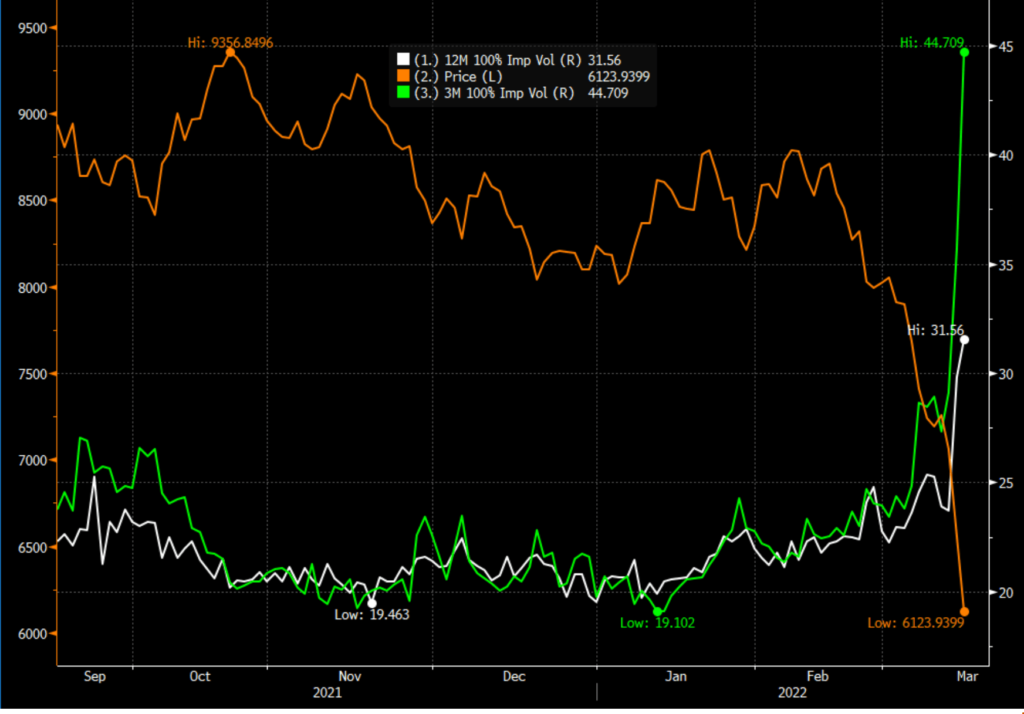
We may now be at a spot level where continuous barriers have been breached and where the vega on European barriers flips. In both cases, dealers have to rush to buy back gamma and volatility that they previously shorted, which provokes a spike in implied volatilities across maturities.
The graph below shows the 3-month implied volatility jumping from 28 to 45 in a couple of days and the 1-year implied volatility from 24 to 31.50. Both are massive moves.