The VIX (for Volatility Index) is an index published by the Chicago Board of Exchange. Often called the “fear index“, it is used in newspapers and by investors to gauge the market sentiment. An elevated VIX would denote some anxiety amongst investors, the fear of a correction or even of a market crash. On the other hand, a low VIX would mean that investors are clam and confident about the future upward trend of the market.
We will remind ourselves of what the VIX is and investigate whether the VIX is a good market predictor.
How is VIX computed?
By construction, VIX is an average of 30-day options on S&P 500. According to CBOE, here is how to compute the value of VIX

The formula can seem complicated. In that computation, options of strike K are given a weight of (1/K)^2. So puts have a higher weight than calls: precisely the 80% Put will have a weight that is twice bigger than the weight on the 120% Call. The computation is done real time and if 30-day maturity options are not available, their price is interpolated with options of similar maturities.
The formula above is complex but people familiar with financial mathematics will recognize that it is the expression of the implied 30-day variance of S&P 500. And that is the real and only definition of VIX!
Numerically a VIX at 16 means that the way traders price options mean that they expect and average daily move of +/-1%. A VIX at 32 means that the expected average daily move is +/-2% on S&P500.
Is VIX a good predictor of future S&P 500 performance ?
Let’s first look at some of the worst S&P daily returns since 1993 (when VIX was created). Although on the days below, the VIX seems quite high (before open), it goes even higher after the close.
A VIX at only 34.74 preceded a return at -8.79%, whereasa VIX at 57.53 preceded a day at -7.63%.But in all cases VIX rises sharply after all those very negative days: VIX seems more reactive than predictive.
|
Day |
S&P return | VIX before open | VIX after close |
|
16/03/2020 |
-11.98% |
57.83 |
82.69 |
|
12/03/2020 |
-9.51% |
53.90 |
75.47 |
|
15/10/2008 |
-9.03% |
55.13 |
69.25 |
|
01/12/2008 |
-8.93% |
55.28 |
68.51 |
|
29/09/2008 |
-8.79% | 34.74 |
46.72 |
|
09/10/2008 |
-7.62% | 57.53 |
63.92 |
| 09/03/2020 | -7.60% | 41.94 |
54.46 |
If we look at the best days, we could be even more surprised. The best days happened while VIX was very high, and actually even higher than before the worst days! After those very good days, VIX then tend to fall sharply.
The reason is simple: the high level of VIX before those best days comes from the sharp fall in the markets the days before, so here again the high VIX is only reactive and not predictive
|
Day |
S&P return | VIX before open |
VIX after close |
|
13/10/2008 |
+11.58% | 69.95 |
54.99 |
|
28/10/2008 |
+10.79% | 80.06 |
66.96 |
|
24/03/2020 |
+9.38% | 61.59 |
61.67 |
|
13/03/2020 |
+9.29% | 75.47 |
57.83 |
If we extend this sturdy to the entirety of the period since 1993, and plot on x the level of VIX and on y the subsequent 5-day S&P return.
No strong relationship seems to emerge.

We can also look at the 5-day return as a function of the absolute change of VIX, here again no relationship:

The only relationship that is very clear is the way VIX moves given how S&P 500 moves at the same time. here is the a graph plotting on y the 1-day return of S&P and on x the absolute change in VIX. A proof if needed that VIX is reactive to S&P 500 moves but not predictive

Is VIX a good predictor of future volatility?
By construction, VIX is a weighted average of 30-day options and corresponds to the expected 30-day variance of S&P500. So we could expect VIX to predict future volatility correctly. For that purpose let us plot on x- the level of VIX, and on x. the subsequent 5-day realised volatility. The graph shows that the prediction is far from being satisfactory, as the cloud of points is far from being a straight line. Furthermore VIX seems to overestimate the future realised vol as the regression slope is 75% only.
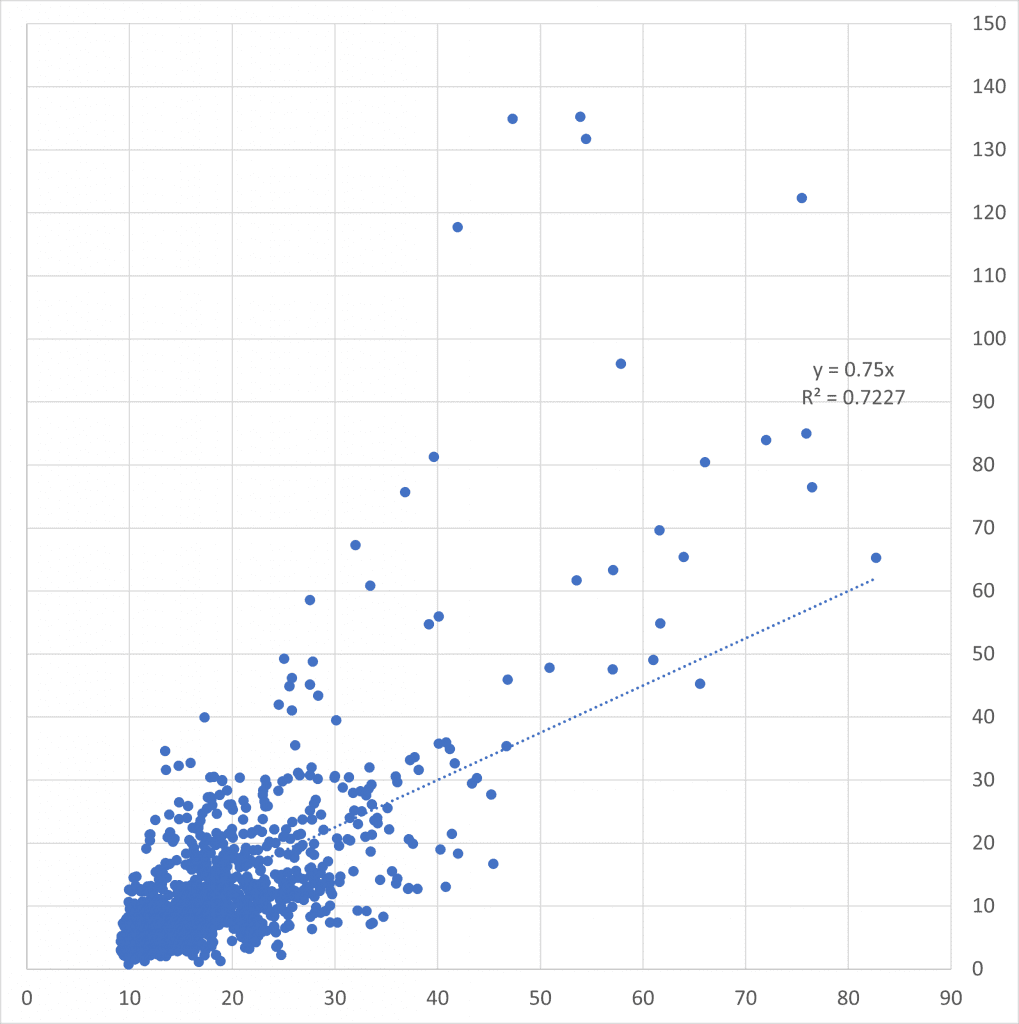
As a conclusion, VIX is indeed useless at predicting future S&P returns. It reacts to past returns and can be an indicator of future volatility.