For investors looking for yield, autocallables on indices have been a blockbuster for years. The principle of the autocallable payout is simple: the investor gets coupons that are substantially higher than the prevailing interest rates but they put their capital at risk.
On each annual observation date, the payment of those coupons is subject to the equity index being above a predetermined level. At maturity if the equity index is above a barrier (typically fixed at 60% or 70% initial level), the full capital is reimbursed. If the equity index is below the barrier, say 55%, then the investor gets only 55% of their initial investment back.
Billions of euros of such autocallables are issued every year in Europe. As such, banks’ trading desks accumulate the same risk: they are long dividends and long volatility on those indices, especially on the Eurostoxx 50. The covid outbreak of 2020, where companies unexpectedly cut their dividend payment, was the source of hundreds of millions of euros of losses for those houses. They are now pushing special indices (so-called decrement indices), designed to offer higher coupons and reduce the risks on the banks’ trading books.
We will first describe how those decrement indices are designed, how they differ from real indices and the potential consequences for the investors and for the banks.
How usual indices are constructed and their economic meaning
Most equity indices are market capitalisation weighted: it means that every stock in the index has a weight proportional to its market capitalisation. Additionally, most equity indices are price return, which means that dividends are not reinvested in the index.
The way a price return index evolves does not represent the evolution of the wealth of an investor who would hold a portfolio made of the index components. Let us assume that the Eurostoxx 50 is now at 4,000, the investor will need to pay €4,000 to buy one unit of that portfolio. If the Eurostoxx 50 reaches 4,400 one year later, the investor will have made 400 euro per unit and pocketed dividends (let’s say 120) while holding the portfolio. Despite the Eurostoxx being only at 4,400, the wealth of the investor is 4,520. The price return of the index is 10%, whereas its total return is 13%. The price return index underperforms the total return index by the dividend amount.
Although the 4,400 level does not represent the wealth of the investor, it represents the price that an investor will have to pay to buy one unit of the index in one year.
Hence, for different reasons, both the total return and the price return versions of an index have an economic meaning.
Decrement Indices: definition and (lack of) economic meaning
A decrement index is a synthetic index: similarly to a price return index, it takes as a base a total return index and detaches dividends, but here those dividends are set in advance. This synthetic dividend is called decrement or contractual dividend.
It is usually paid continuously (so a little bit every day as opposed to twice or four times a year). It can be defined as a percentage (very often five percent) or as an absolute number of points. As such, every day the decrement index will diverge from the total return index by the daily decrement.
Unlike a total return index or a price return index, a decrement index has no economic meaning as the decrement is (often) set to a level that is unrelated to the real dividends.
The advantage for the banks is obvious: as the synthetic dividend is agreed in advance, there is no dividend risk anymore for the banks. Only the volatility risk remains.
The advantage for the client is that the decrement indices provide higher coupons than normal indices, at a time where the real indices exhibit distressed dividend levels.
The dividend market and its implication on the attractiveness of autocallables
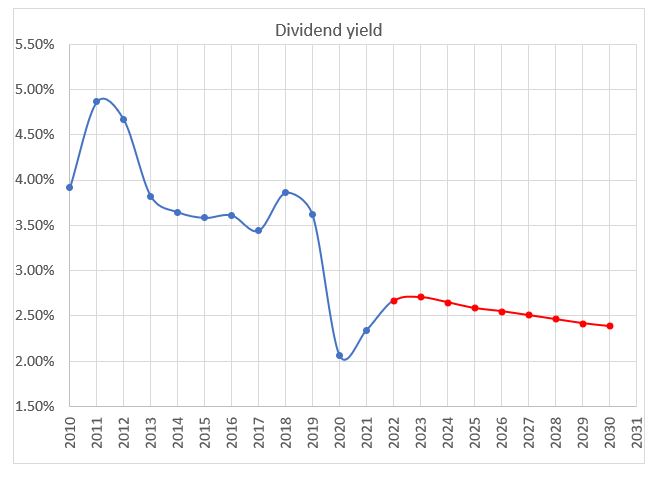
Below is a table recapping the dividend yield of the Eurostoxx 50:
- For the years up to 2021, we display the historical value.
- For 2022 onwards we display what the market implies.
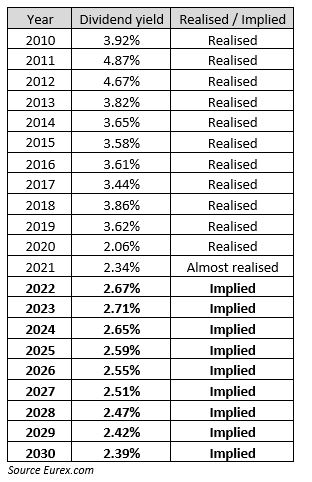
(A realised dividend yield is computed based on the following calculation: Dividend points / Average of the index at beginning and end of the year. An implied dividend yield is computed based on the following computation : Dividend points /Current index level)
Here is a graphical representation of that dividend yield. The blue part corresponds to the past realised dividend. The red part shows the implied dividend market (from the dividend futures market).
Three main lessons:
- In the period 2010-2021, the dividend yield of the Eurostoxx 50 has never reached five percent which seems to be the standard decrement level for European decrement indices.
- The dividend shock attached to the 2020 pandemic shifted the dividend yield from the 3.50% to the 2.50% area.
- The term structure of the implied dividend is downward sloping. Long term dividends have implied levels even lower than short term ones. That phenomenon is due to structured product desks that are constantly selling long term dividends to hedge long autocallable products.
With those depressed levels of implied dividend, the Eurostoxx index does not offer very attractive coupons when used as an underlying for autocalls. No surprise then that decrement indices get a lot of interest from investors, but with higher coupons usually come higher risks…
Performance of decrement indices
By construction, a decrement index will perform differently than a real index.
The difference in performance will be exactly the difference between the real dividend yield of that index and the decrement. If during one year, the real index has a dividend yield of three percent, a five percent decrement will underperform the real index by 2.00%.
Below we plot the performance of the real Eurostoxx 50 and the Eurostoxx 50 5% decrement.
Very clearly in the early years where the dividend yield was close to five percent, both indices had similar returns. But since 2013, the underperformance of the decrement index is important.
Over the observation period, the decrement index underperformed by a bit more than 20%. If the decrement had been chosen at more reasonable level (three percent for instance which is equal to what the dividend has actually realised over the period), there would not be such an underperformance.

One can easily estimate the underperformance of a decrement index over the real index:
Underperformance ≈ maturity * (decrement dividend yield – real dividend yield)
If one believes the real dividend yield of the Eurostoxx will be three percent, one could choose a three percent decrement Eurostoxx index. It would provide a higher coupon because three percent is still higher than the implied dividend of 2.5% but should not exhibit any future underperformance.
On the other hand, going for a five percent decrement will lead to a higher coupon but is almost the assurance of future underperformance.
Percentage decrement versus fixed point decrement
Although the decrement is usually defined as a percentage, it can be sometimes defined as a fixed amount or number of index points. It means that wherever the index will be in the future, the same absolute amount will be deducted from it.
Imagine an index starting at 1000 points. Let us assume that index has a natural dividend yield of 3%, let us assume we create two decrement indices one with 5% decrement and one with 50 points decrement. With an initial index level at 1000, both decrement seem equivalent as they have the same yield of 5% (50/1000 = 5%).
Imagine the total return index goes quickly to 700 and stays there for one year, the price return index will be roughly 97% *700 = 679. The five percent decrement index will be at 95%*700 = 665, and the 50 points decrement will be 650 (700-50).
After one year, we will have the following performance:
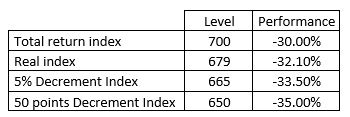
As time goes and if the index stays at the level, the underperformance of the 50 points decrement will increase versus the five percent decrement.
On the contrary, the 50 points decrement will outperform when the index has a positive performance. Let’s take the case of a total return index going quickly to 1500.
The real index will be 97%*1500 = 45.50%, the 5% decrement 95%*1500 = 1425, and the 50 points decrement 1500 – 50 = 1450.
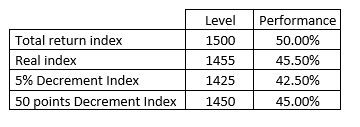
So here the 50 points decrement performs well.
But buying an autocallable, the investor does not benefit from the upside of an index (the maximum payout of an autocallable is equal to the coupon) and is only penalised on the downside. This outperformance on the upside is irrelevant to the investor. On the contrary the underperformance on the downside can be dangerous for the investor as it could eat into his initial investment.
Composition and marketing of decrement indices
As we have seen, the historical dividend yield of the Eurostoxx being 3.50%, the five percent decrement Eurostoxx 50 will exhibit a historical underperformance of 1.5% per annum. This does not make the marketing of such indices easy.
One possible twist consists in modifying the index slightly to introduce some historical outperformance. It is usually achieved by applying equal weights (as opposed to market cap weights) to the component of the index.
The graph below shows:
- in white the real Eurostoxx;
- in blue the Eurostoxx 50 decrement 5%; and
- in red the Eurostoxx 50 decrement 5% equally weighted.
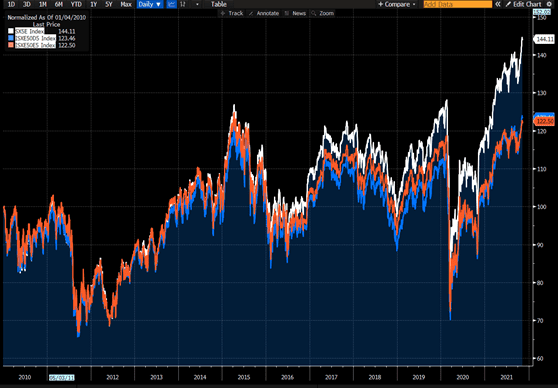
One can see that the equally weighted decrement managed to create some outperformance until 2019 (red over blue thanks to the size factor) but it has underperformed since then. Nevertheless, both decrements underperformed the real index and the marketing issue is not resolved.
Then one needs to add some additional marketing flavour to the decrement index and change its name, so it becomes a benchmark as such and is not compared anymore to an existing index. Very often, fashionable or attractive keywords are used (look for ESG, Green, Zero Emission, Ocean, Select, Climate, Impact, Leaders etc). Structured product houses then tend to come up with their own thematic decrement indices over which they have exclusivity. That’s obviously not good news for end investors as it makes the comparison of the different offerings more complex.
Hedging (and marking) the volatility of decrement indices
As we saw, the composition of the decrement index is usually different from the real index. To hedge the volatility, the trader would ideally trade options on the decrement index, but they do not exist. So the trader will sell options on the closest real index.
They will be long vega /gamma on the decrement index and short vega /gamma on the real index. They will carry this spread risk across the life of the product. So it is in the trader’s interest that the compositions of the two indices are as similar as possible, to minimise the spread between the volatilities of the two indices.
Beyond the difference of the composition, let’s see how the decrement itself introduces a difference in implied volatility. For the sake of simplicity let us assume that interest rates are zero. We want to hedge a 10-year at-the-money (ATM) put on the five percent decrement Eurostoxx (market cap weighted as the real index) – the only option available are options on Eurostoxx. Should we buy an ATM put on the Eurostoxx?
The answer is no, as it would mean that the five percent decrement ending at 100% is equivalent to the real index ending at 100%. Given the difference in expected dividend, it cannot be the case.
Namely, if the five percent decrement index ends at 100% and the real index has an implied dividend of 2.50%, one would expect the real index to be at
So to hedge the ATM put on the five percent decrement index, the trader should sell the 128.40% strike on the real index. And so the ATM implied vol of the five percent decrement should be equal to the 128% strike volatility of the original index; looking at the volatility surface of the Eurostoxx below, this equates to a 1.64 volatility point difference (18.47% – 16.83%).
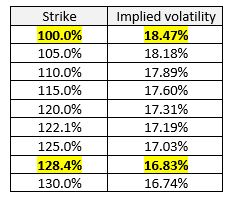
So the trader’s position will be:
- Long the 100% strike put on five percent decrement Eurostoxx (vol 16.83)
- Short the 128.40% strike put on the Eurostoxx (vol 16.83)
Let us assume nothing moves in the market, except the implied dividend yield of the Eurostoxx which moves from 2.50% to 3.00%. Then the ATM volatility of the five percent decrement should correspond to a strike of
So the new ATM volatility for the five percent decrement should be remarked to 17.19 (from 16.83) and the trader will make some money on his long position.
So, because of the volatility skew of Eurostoxx, the trader still has long dividend risk, even with a decrement index. Obviously that dividend risk is only a second order effect with much less amplitude that the plain dividend risk a non-decrement index would expose the trade to. But as notionals on those autocallables are issued in extremely big sizes, it cannot be ignored.
Conclusions on decrement indices
- Decrement indices are effective underlyings for banks to remove most of the dividend risk and for investors to generate high coupons.
- The level of the decrement is key: setting it too high is the assurance of future underperformance versus the benchmark.
- Fixed points decrements (as opposed to percentage decrements) are particularly dangerous on the downside.
- The underperformance is often hidden by adding marketing tricks or overweighting (only slightly) factors that performed in the past (eg size).
- For the banks, there is still some risk
- the spread in volatilities (due the difference of composition) between the decrement index and the liquid index
- some dividend risk due to the volatility skew of the liquid index.

